Pulmonary Function Studies
Spirometry
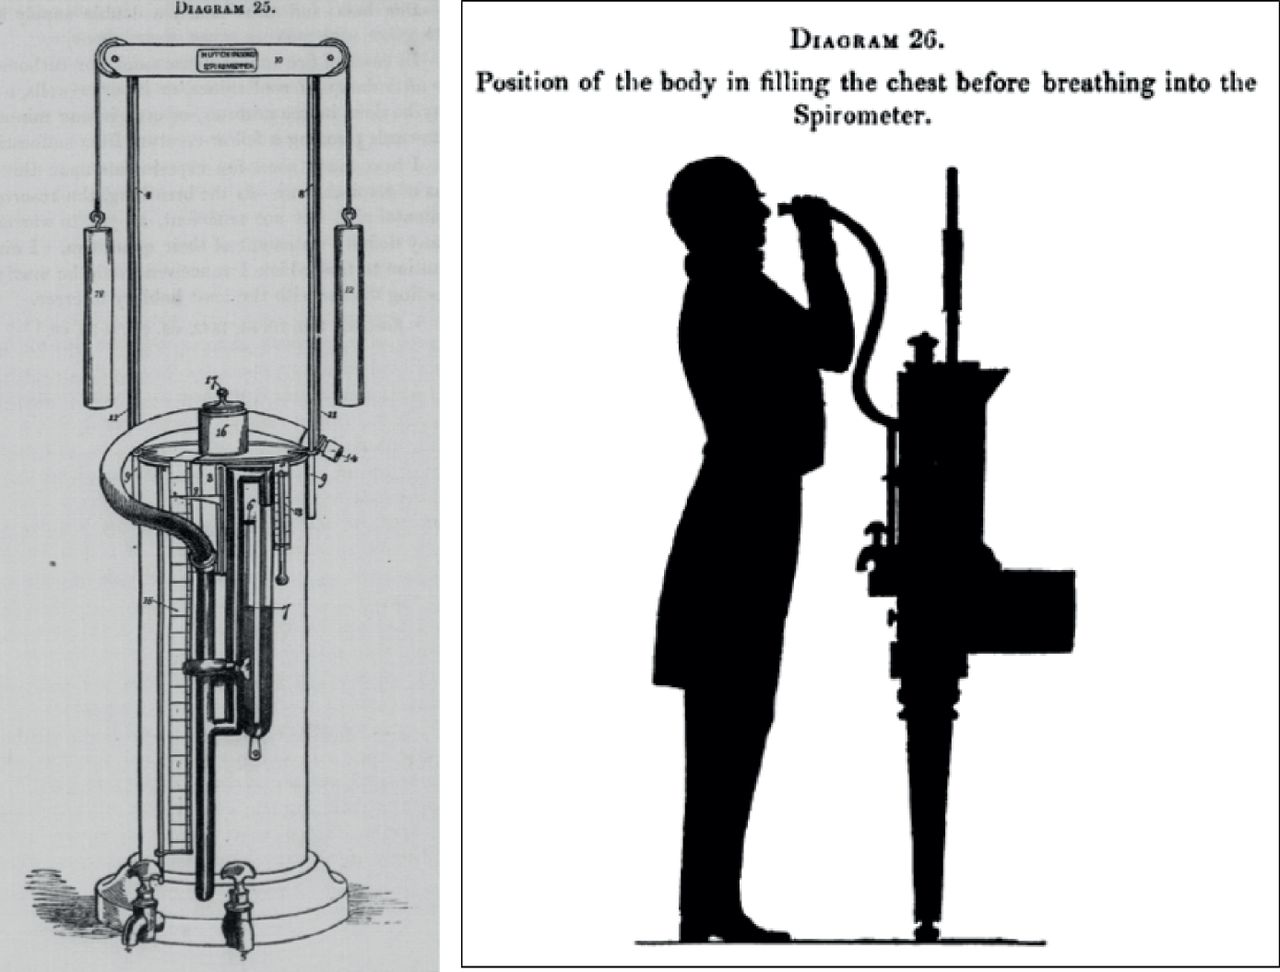
The spirometer was originally invented in the 1840 by John Hutchinson, an English surgeon. The device (which was as tall as an adult patient) was essentially a calibrated bucket that was placed upside down in water. The volume of exhaled air from fully inflated lungs could accurately be measured by exhaling into a tube leading into the bucket. Dr. Hutchinson coined the term vital capacity (i.e.,capacity for life), when he realized that compromise of this crucial measurement was predictive for premature mortality.
Because of the strong correlation he identified between vital capacity and mortality, Hutchinson argued that his Vital Capacity should be utilized in actuarial predictions for life insurance policies. Sadly for Hutchinson, neither the spirometer nor its measurements were accepted by the medical field or the insurance industry.
What do you think was the most likely cause of the reduction in vital capacity that Hutchinson was measuring in 1840?

Interest in spirometry was renewed on a wider scale in mid 20th century when it was observed that the predominant respiratory disorders (asthma and COPD) were obstructive (limited flow rate) in nature. In 1950 Dr. Tiffeneau of France introduced the forced measurement of air volume during a given time frame, i.e., forced expiratory volume in 1 second, FEV1.
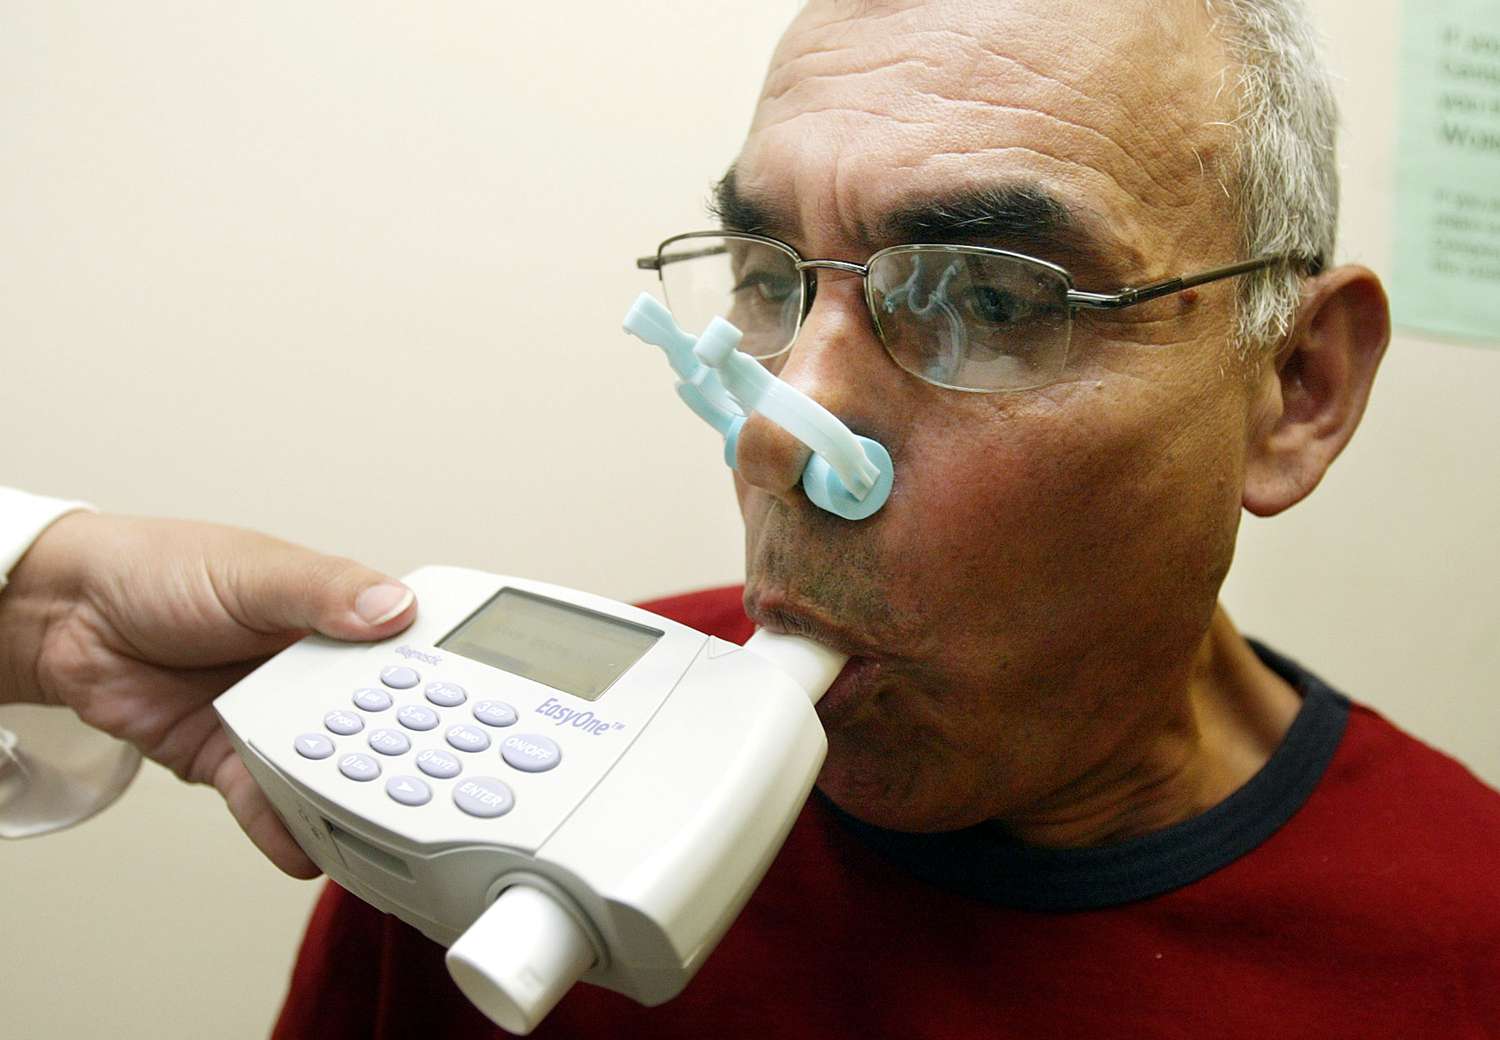
Spirometry is now widely available and may be utilized in almost all clinical scenarios, even in the home environment.
An importance consideration in the interpretation of spirometry is that the results of the exam are determined not only by the underlying pathophysiology of the patient, but also the engagement of the patient AND the person performing the study.
A paradox of the medical office environment is that the person with the least amount of clinical experience is often assigned the measurement of vital signs. In settings where spirometry is infrequently performed, the quality of the data tends to suffer. There is an old adage of medical testing Crap In - Crap Out. Attempting to interpret bad spirometrymay cause more problems than having no data at all.
System for Interpreting Spirometry
Much like interpreting an ECG, the evaluation of spirometry should be approached in a systematic fashion.
- Is Obstruction present?
- Is Restriction present?
- What is the severity of the respiratory defect?
- What is the quality of the exam?
- Is there any evidence of large airway dysfunction?
To answer these questions you will need just five parameters from the spirometric data:
- Volume of air exhaled in the first second (FEV1)
- Volume of air exhaled by the end of the breath (Vital Capacity or FVC)
- Ratio of FEV1/FVC sometimes referred to as FEV1%
- Flow-Volume Loop
- Volume Time Loop
What is “normal”?
From the onset of spirometry there has been a debate surrounding the definition of "normal". Early on it was recognized that lung function varied widely among individuals. Some of this variability was due to underlying disease processes, but much of it was due to normal physiologic differences between individuals. In an effort to standardize the interpretation, researchers measured and created regression equations of healthy volunteers. This has led to a plethora of prediction equations over the years that can vary quite a bit on the resultant % predicted for a given individual. While there is no offical standard one must be aware of the prediction equation being utilized by the spirometer in use. Fortunately since the definition of a milliliter is constant, the raw data for spirometry is comparable across devices. In the present day most spirometers have adopted the Global Lung Initiative (GLI) prediction equations as the default for spirometry. The GLI database is the largest and most diverse database of spirometry prediction equations ever assembled and continues to grow.
I have had the personal experience of interpreting serial spirometric data to be concerned or encouraged by a significant change in the % predicted only to find on closer assessment the the change was not in the patient’s lung function but in the default prediction equation of the spirometer. Hence my current habit of recording but the absolute values AND % predicted in my clinical notes.
From the early studies in spirometry it became apparent that four factors correlated the most strongly with the measured values for lung function:
- Age
- Height
- Gender
- Ethnicity
In order for these parameters to be useful they must be entered correctly. If you ever get a spirometry report with non-sensical precent predicted, the first place to look is the demographics
What demographic do you think is the most common erroneous entry for calculation of precent predicts and why?
Later in the assessment of spirometric abnormalities I will present quantitation scales of severity based on % predicted. GLI has adopted a different system based on the Z-score of the spirometric value. In much the same way and many laboratory tests, the 'normal' range is determined as the mean for the population plus or minus 2 standard deviations. The Z-score is the number of standard deviations a given value is from the mean. A Z-score of -1.64 corresponds to the 5th percentile and is roughly equivalent to 80% predicted for most spirometric values. There is a clear shift in the world of pulmonary function intrepretation in favor of Z-scores and not % predicted to define the presence and severity of disease states.
There are two limitation of precent predicted equations. The first is that by the nature of normal distributions 5% of the 'health' population will have a value outside of the “normal” range of 80-120% of predicted. Since the bulk of the pulmonary function studies I order are for the assessment of respiratory symptoms, if all I have is one value I have no reference point of what is 'normal' for that patient. Therefore without the context of a prior study, it is posssible that a patient with a 'normal' % predicted may in fact have a significant reduction in lung function from their personal baseline.
A second issue is that in the generation of prediction equations, the population of young individuals without lung disease is vast. As the population ages that disease-free segment diminishes. There are many spirometry units that will not generate a % predicted if the patient is > 80. In situations where you are assessing very old patients, keep in mind that the calculated normal are debatable and may over estimate the degree of impairment. The last factor is less of an issue with the GLI equations since they have data for individuals up to 95 years of age.
Is Obstruction Present?
Individuals with airway disorders due to airway narrowing or loss of elastic recoil, have trouble exhaling air in a rapid fashion. If these individuals are given enough time their lung can completely empty. We represent this delay by the ratio of the fraction of air exhaled in the first second (FEV1) divided by the total amount of air exhaled (FVC). This value is displayed as a percentage on most spirometers - FEV1% or FEV1/FVC.
While the Gold Initiative for the Lung Diseases (GOLD) guidelines has done much to standardize and enhance the care of patients with COPD, they has ingrained in the literature that obstruction is a FEV1% less than 0.7 (or 70%).
As with many generalizations made for the purposes of guidelines it is not an unreasonable compromise, for middle age patient being evaluated for obstructive lung disease. Because of the normal evolution of airway elasticity with age, the fixed ratio of 0.7 tends to over diagnose obstruction in the elderly and under diagnose obstruction in the young.
While the FEV1% is our primary parameter for the detection of obstruction, why can we not use it to determine the severity of that obstruction?
My preference for this parameter is to look at the precent predicted for the FEV1%. If this value is less than 90% you can feel confident that airway obstruction is present. A second option is the look at the Z-score for the FEV1/FVC ratio. A Z-score less than -1.64 (5th percentile) is consistant with obstruction.
Is Restrictive Disease present?
The FVC is the primary parameter in spirometry for the determination of restrictive disease. When the FVC is less than 80% predicted the patient has evidence of restriction. At this stage we do not know the etiology of the restriction or if the reduction in FVC is due to pseudorestriction from underlying obstructive lung disease.
In circumstances when you are evaluating a patient with known interstitial lung disease, the FVC is the value of choice for grading the severity and secondarily the life expectancy of this population.
| FVC % Predicted | Severity of Impairment |
|---|---|
| > 80% | Normal |
| > 70-80% | Mild |
| > 60-70% | Moderate |
| > 50-60% | Moderately Severe |
| < 50% | Severe |
Severity of Respiratory Impairment?
While I referred above that the FVC is the preferred parameter for assessing the severity of ILD, the FEV1 is the value for assessing the severity of obstructive diseases. Since individuals with ILD tend to have an enhanced elastic recoil due to the underlying fibrosis, and high FEV1/FVC ratios, often > 85%. It is not a bad option for interstitial disease as well although the criteria for disease severity in obstructive diseases with defined over a broader range than ILD. Again the lower end of the normal range is defined as 80%.
| FEV1 % Predicted | Severity of Impairment |
|---|---|
| > 80% | Normal |
| > 65-80% | Mild |
| > 55-65% | Moderate |
| > 45-55% | Moderately Severe |
| < 45% | Severe |
| < 30% | Very Severe |
One reported advantage of the new GLI system is that the scale for determination of severity is that the same for all the parameters evaluated.
| Z-Score | Severity of Impairment |
|---|---|
| > -1.64 | Normal |
| > -1.64 to -2.5 | Mild |
| > -2.5 to -3.5 | Moderate |
| > -3.5 to -4.5 | Severe |
| < -4.5 | Very Severe |
There is also a unique situation with obstructive lung disease in that an individual may show evidence of obstruction on the basis of the FEV1/FVC ratio, but the FEV1 is in the normal range. The current thinking is to label this patient with obstructive lung disease, for these individuals are at increase risk for progressive impairment if they are smokers than those without a reduced FEV1/FVC ration. You may still encounter interpretations that will not define obstructive lung disease unless BOTH the FEV1/FVC ratio and the FEV1 are abnormal.
What is the quality of the exam?
Most primers on the interpretation of spirometry stop after the analysis of FVC, FEV1 and FEV1/FVC ratio. Clearly I would not dedicate a section to the analysis of the quality of the exam unless I felt that there was useful information to be gleaned.
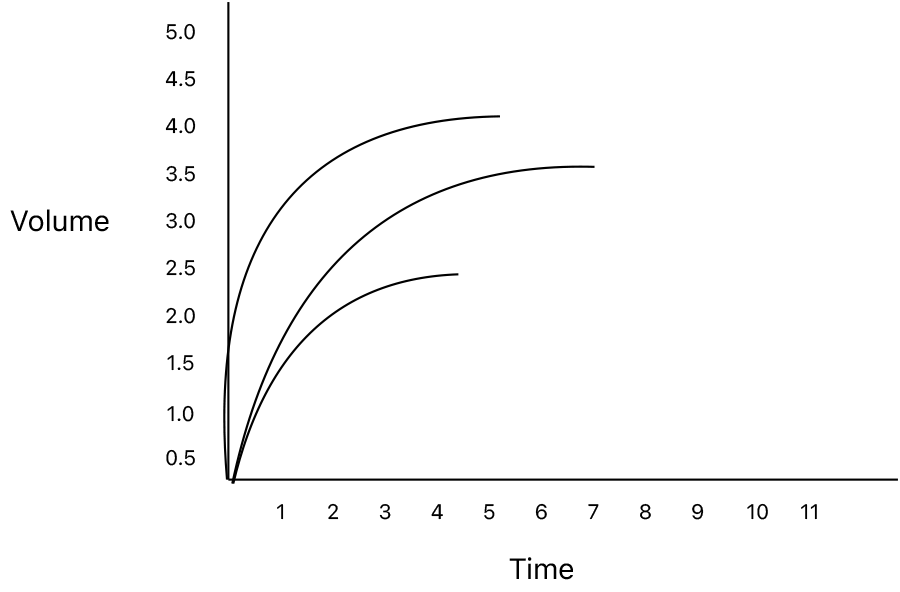
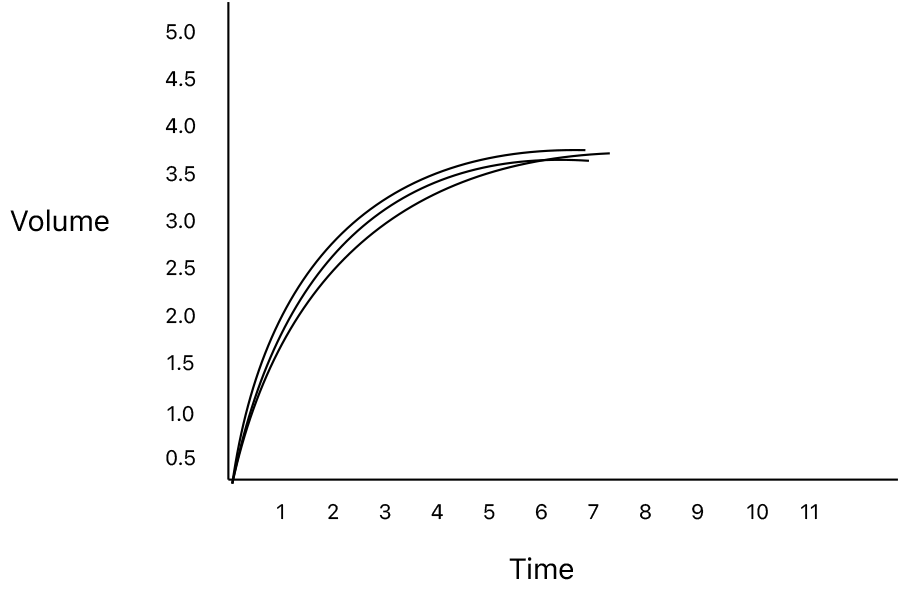
The first tool we have for the assessment of Spirometry is did the patient meet reproducibility criteria. The forced expiratory maneuver should be performed a minimum of three times with the values showing no more than 150ml variability. The reported value for the study should be the best values for the FVC and FEV1. Budget spirometers are infamous for choosing what the device feels is the best effort for seemingly random reasons. So, if presented with the data for multiple trials verify that the chosen study for the report was indeed the best value.
To encourage this, the software of many spirometry systems has cues for when the patient has met this criteria. This cue is unfortunately interpreted by many technicians performing spirometry as a end of test criteria. As we have discussed above the fundamental pathophysiology of obstructive lung disease is a slowing of the expiratory flow rates. I have seen properly coached volume time graphs of patients with advanced airway obstruction where the patient was able to exhale for more than 30 seconds. Currrent ATS/ERS standards, however, do not encourage exhalation beyond the point where the volume-time curve has reached a plateau or the patient has exhaled for 15 seconds, whichever comes first.
What is the impact of incomplete exhalation on the values for spirometry?
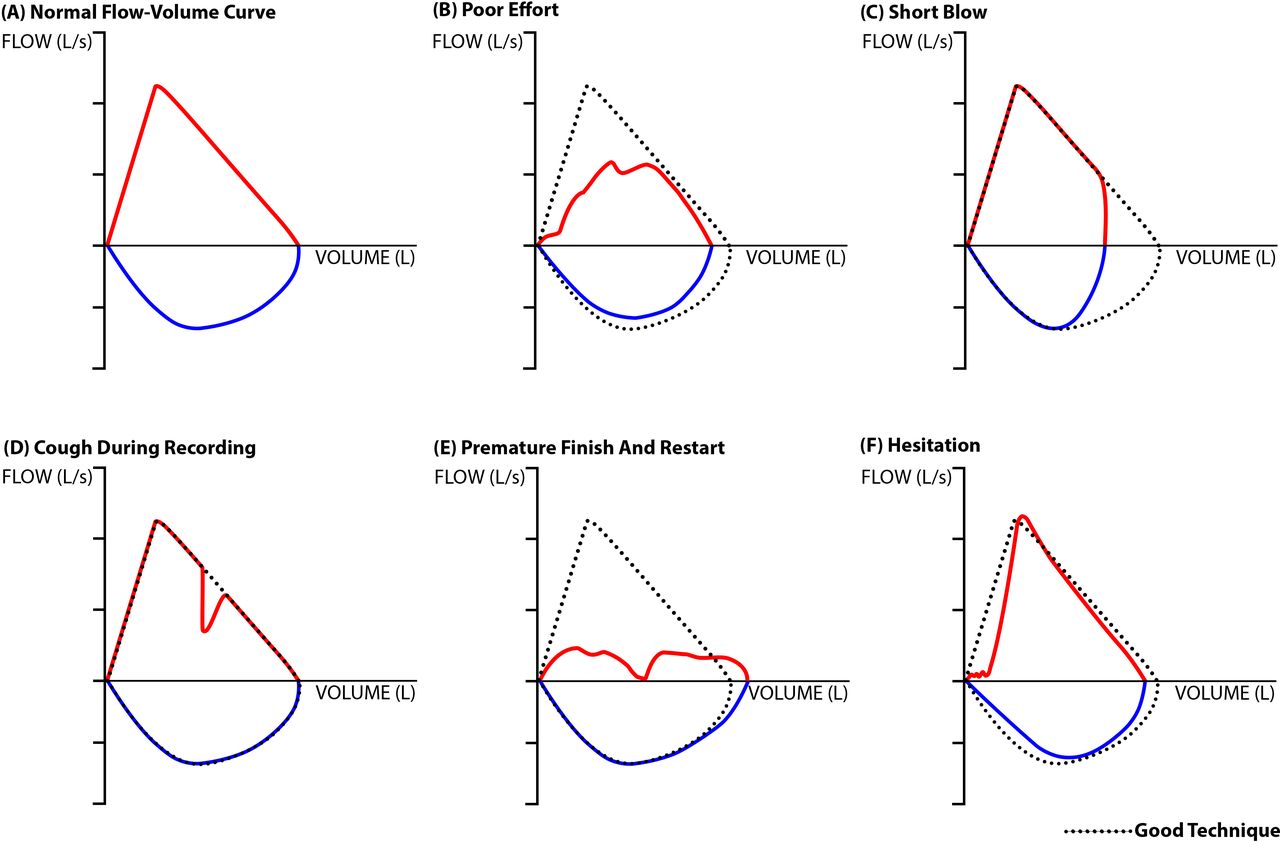
Examination of the Flow-Volume and Volume-Time loops can also give you an impression of the patient to perform the initial expiratory blast and completion of the forced maneuver.
Even in the absence of pathology, exhalation to residual volume (RV) is an uncomfortable experience. There is currently discussion among Spirometry Standards Work Groups to modify the FVC maneuver to consistent of encouragement of an initial blast to maximize the measured FEV1 followed by a slow pace of forced exhalation stopping when the patient mets the 1 second volume plateau or has exhaled for a maximum of 15 seconds.
From the focus of this section, it should be apparent about the value of the technician performing spirometry. ATS standards for spirometry encourage the technician to instruction the patient on strong BOTH strong the expiratory and inspiratory portions of the effort. Since the calculated parameters are overwhelmingly obtained from the expiratory portion.
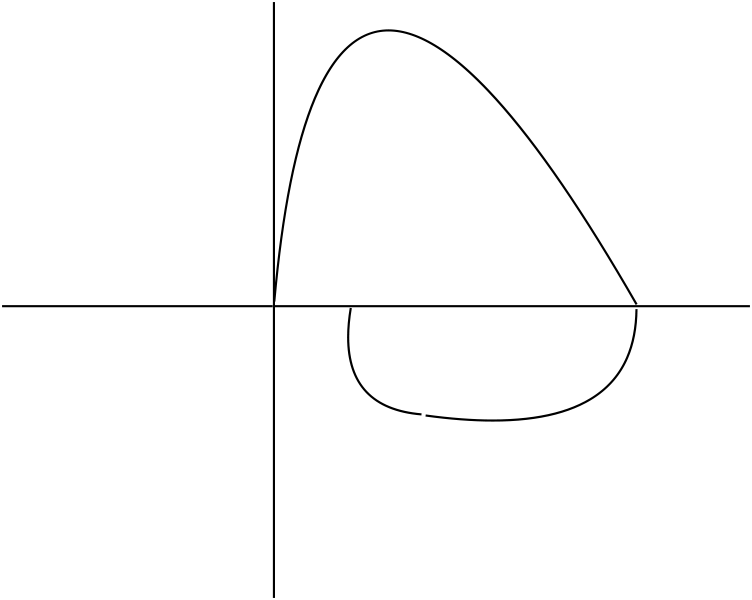
In your interpretation of spirometry you observe the following Flow-Volume Loop
What is the impact of this patient’s effort or coaching on the resultant spirometry?

A final piece of information that can be learned from the Flow-Volume loops relates to upper airway function. While far less common than the obstructive and restrictive processes that we will discuss in the course of your rotation, these conditions are often confused with those conditions. Since they are largely mechanical they will only response to surgical management.
When I individual is developing a large airway disorder, the brain will recognize the impact of forced effect and make subconscious decisions to optimize function. The position of the pathology impacts the resultant changes in the Flow-Volume Loop. The sternal notch that roughly corresponds to the the level of the vocal cords divides the extra thoracic from the intra thoracic airway. Because of the rigid nature of the tracheal rings the intrathoracic airway is not influenced as much on inhalation as it it on exhalation. At roughly the level of the vocal cords and above, the changes in flow are more apparent on inhalation. As the process progressed then narrow will eventually influence the flow rates during both inspiration and exhalation.
There is on caveat to this evaluation. The focus of spirometry is the expiratory side since this is where the volumes of interest are calculated. When the technician is less experienced, once the patient reaches the end-point of that effort all coaching stops. Below are some common examples of passive inspiratory efforts, that could be misinterpreted as a variable extra thoracic defect.